
Prime example of why....
 25-10-2008, 04:15 PM
#1

....Dyno's get a bad name.
Whilst looking for some info, I came across these graphs.
They supposedly show an R8 (Milltek) before modification and after fitting their cat-back exhaust.
Before.....

After.....

For those that don't know, if you look at the first graph, in the data at the bottom, you'll see 2 values. 'AT' and 'IT'. The 'AT' value is ambient air temp. This of course should be something like the current temperature. The 'IT' value is intake air temp. We look for a maximum deviation of 8�c between these 2 values. There's 28�c difference on this graph. The dyno will be applying a massive compensation as a result of this.
Also, that run was carried out in 'Shoot_8' mode, which is for 8-cylinder engines.
Now look at the second graph. Again, check the AT and IT values. AFPMSL. 76�c. That is just plainly insane. We'd use those graphs for nothing more than toilet paper. However, just as significant is the fact that the second run was carried out in an entirely different mode 'Shoot44', which is for 4-wheel-drive cars. So, with both plots on the one graph, comparison is just ridiculous and would make their work look better than it actually is.
Incidentally, the car only reached just over 80mph in the first graph. What's that all about?? LOL.
Whilst looking for some info, I came across these graphs.
They supposedly show an R8 (Milltek) before modification and after fitting their cat-back exhaust.
Before.....
After.....
For those that don't know, if you look at the first graph, in the data at the bottom, you'll see 2 values. 'AT' and 'IT'. The 'AT' value is ambient air temp. This of course should be something like the current temperature. The 'IT' value is intake air temp. We look for a maximum deviation of 8�c between these 2 values. There's 28�c difference on this graph. The dyno will be applying a massive compensation as a result of this.
Also, that run was carried out in 'Shoot_8' mode, which is for 8-cylinder engines.
Now look at the second graph. Again, check the AT and IT values. AFPMSL. 76�c. That is just plainly insane. We'd use those graphs for nothing more than toilet paper. However, just as significant is the fact that the second run was carried out in an entirely different mode 'Shoot44', which is for 4-wheel-drive cars. So, with both plots on the one graph, comparison is just ridiculous and would make their work look better than it actually is.
Incidentally, the car only reached just over 80mph in the first graph. What's that all about?? LOL.
 25-10-2008, 04:32 PM
#4
Well, tell me how on earth they measured 87�c at the temperature probe that is supposed to measure intake temp?
Surely that's about the same temperature as a fresh cup of coffee?? or between the fins of the radiator?
Personally, I think the fact that they plotted against 'Speed' and not 'RPM' is because they didn't actually measure RPM, and thats not the best way to do things either.
Surely that's about the same temperature as a fresh cup of coffee?? or between the fins of the radiator?
Personally, I think the fact that they plotted against 'Speed' and not 'RPM' is because they didn't actually measure RPM, and thats not the best way to do things either.
25-10-2008, 04:37 PM
#6
It's actually adequate to have the sensor in the 'vicinity' of the Air Intake. In reality, the air that is drawn in doesn't spend long enough into the engine bay to be too affected by engine-bay temps, especially with the bonnet up.

Trending Topics
25-10-2008, 05:33 PM
#9
Advanced PassionFord User

Join Date: Dec 2004
Posts: 1,962
Likes: 0
Received 0 Likes
on
0 Posts
interesting you just started this as i've been somewhere else where the dyno dynamis rr seemed to be playing up.
i had a RR done today and for some reason the RR kept throwing up some weird results- my 2litre focus mad 171bhp for example at one point
heres one he did later on after a reboot of the system- do the settings look ok? ignore the map i think i'm gonna chuck me bluefin in the bin

i had a RR done today and for some reason the RR kept throwing up some weird results- my 2litre focus mad 171bhp for example at one point
heres one he did later on after a reboot of the system- do the settings look ok? ignore the map i think i'm gonna chuck me bluefin in the bin
Last edited by Chris69; 25-10-2008 at 06:24 PM.
25-10-2008, 06:33 PM
#11
Advanced PassionFord User
Join Date: Dec 2004
Posts: 1,962
Likes: 0
Received 0 Likes
on
0 Posts
the're very new mate and hes only recently got this RR thats why i put the post up to try and get some feedback as i'm sure you'll appreciate he doesn't want a bad rep for non accurate results after spending so much money on wot is regarded as the best RR out there atm.
25-10-2008, 06:39 PM
#13
Advanced PassionFord User
Join Date: Dec 2004
Posts: 1,962
Likes: 0
Received 0 Likes
on
0 Posts
25-10-2008, 06:51 PM
#15
Advanced PassionFord User
Join Date: Dec 2004
Posts: 1,962
Likes: 0
Received 0 Likes
on
0 Posts
yeah give them a bell mate there just starting out like i said but its nice to have another option and he is very reasonable while trying to sort his workshop out.
sorry for topic hijack i'll shutup now
sorry for topic hijack i'll shutup now
 25-10-2008, 07:58 PM
#17
At least they got one thing right. 
It is WIDE open to abuse, but at least in Shootout mode its obvious for all to see.
As long as the differential is in the range of 0-8�c, it's acceptable. Thats the general rule of thumb. It is right for there to be a correction because the temperature away from the cell, where the weather station is, may not be the same as that in the direct vicinity of where the air is being drawn into the intake, although they won't be too much different.
As long as the differential is in the range of 0-8�c, it's acceptable. Thats the general rule of thumb. It is right for there to be a correction because the temperature away from the cell, where the weather station is, may not be the same as that in the direct vicinity of where the air is being drawn into the intake, although they won't be too much different.
25-10-2008, 08:21 PM
#18
....Dyno's get a bad name.
Whilst looking for some info, I came across these graphs.
They supposedly show an R8 (Milltek) before modification and after fitting their cat-back exhaust.
Before.....
After.....
For those that don't know, if you look at the first graph, in the data at the bottom, you'll see 2 values. 'AT' and 'IT'. The 'AT' value is ambient air temp. This of course should be something like the current temperature. The 'IT' value is intake air temp. We look for a maximum deviation of 8�c between these 2 values. There's 28�c difference on this graph. The dyno will be applying a massive compensation as a result of this.
Also, that run was carried out in 'Shoot_8' mode, which is for 8-cylinder engines.
Now look at the second graph. Again, check the AT and IT values. AFPMSL. 76�c. That is just plainly insane. We'd use those graphs for nothing more than toilet paper. However, just as significant is the fact that the second run was carried out in an entirely different mode 'Shoot44', which is for 4-wheel-drive cars. So, with both plots on the one graph, comparison is just ridiculous and would make their work look better than it actually is.
Incidentally, the car only reached just over 80mph in the first graph. What's that all about?? LOL.
25-10-2008, 08:27 PM
#19
You'd probably find that the second run made less power than the first when you take the temperature compensation out. I can't imagine that Audi got the exhaust on the R8 that wrong.
If I had bought one, I'd be talking to trading standards.
If I had bought one, I'd be talking to trading standards.
26-10-2008, 11:28 AM
#20
PassionFord Post Whore!!
Join Date: Jul 2004
Location: Wiltshire, Bath, chippenham area!
Posts: 7,428
Likes: 0
Received 4 Likes
on
4 Posts
chris, have you still got the graph of when it said your focus made 172? LOL
as after they messed with it. Everyone was getting low readings IMO.. cars making 20-40 bhp less than standard
regardless of if the car was standard or modified lol
as after they messed with it. Everyone was getting low readings IMO.. cars making 20-40 bhp less than standard
regardless of if the car was standard or modified lol
26-10-2008, 11:39 AM
#21
Advanced PassionFord User
Join Date: Dec 2004
Posts: 1,962
Likes: 0
Received 0 Likes
on
0 Posts
he didn't print it off in the end but i'll call him to get him to e-mail me the file on monday- jay/burni has got the print off where his pretty much standard 16v golf gti made 167 on the rollers
tbh i think most of the results where pretty far out be it high or low thats why i put the graph up
Jay said if you put his 123bhp and 167bhp graph next to each other the power an torque curves are quite different which is worrying seeing as its the same car!
tbh i think most of the results where pretty far out be it high or low thats why i put the graph up
Jay said if you put his 123bhp and 167bhp graph next to each other the power an torque curves are quite different which is worrying seeing as its the same car!
 26-10-2008, 06:17 PM
#25
now you point it out, it's obvious
but i would have thought they took thereadings in 4th gear rather than 3rd to give you less transmissio losses to contend with
i suppose it's all to do with giving the figures people expect rather than the figures they need to see eh?
but i would have thought they took thereadings in 4th gear rather than 3rd to give you less transmissio losses to contend with
i suppose it's all to do with giving the figures people expect rather than the figures they need to see eh?

 30-10-2008, 10:43 PM
#29

 31-10-2008, 08:39 AM
#31
people who buy a set of rollers shouldn't really need to be shown how to use them as they should be intelligent enough to figure out the instructions
31-10-2008, 09:26 AM
#32
you must be thinking about when posh blokes who don't know how to drive buy ferraris and lambos and then need to be taought how to drive them in a straight line and in traffic
people who buy a set of rollers shouldn't really need to be shown how to use them as they should be intelligent enough to figure out the instructions
people who buy a set of rollers shouldn't really need to be shown how to use them as they should be intelligent enough to figure out the instructions
We've been using Dyno's for quite a few years now (infact back to about 2001) and have used more than one system, so have diverse experience. We also know that giving out 'fudged' figures is a really bad idea, because it will eventually come back and bite you on the arse and we are not into that.
The truth is that we don't use ours [i]exactly[i/] as we were taught, but the only changes we've made are where we have discovered a better way and a way that gives more consistent figures.
31-10-2008, 10:22 AM
#36

You wouldn't go to any old person to have major surgery or even your engine built. Same should be about dynos, you should only use someone who knows what the fuck they are doing
.
31-10-2008, 10:57 AM
#37
but having a bit of paper in a glass display cabinet on the wall should be able to give yuothe reassurances that those peole on the list can do what they do 
although i'm sure that those unscupolous chracheters might fudge their accreditations as much as their figures
at least we now know what to look out for when we see a graph so for pointing them things out everyone
although i'm sure that those unscupolous chracheters might fudge their accreditations as much as their figures
at least we now know what to look out for when we see a graph so
for pointing them things out everyone
31-10-2008, 11:00 AM
#38
PassionFord Post Troll
I had my old Si done on a Dyno Dynamics RR a few years ago now and I didnt have a clue what all those figures meant on the bottom just noticed they had my tyre pressure at 40psi  if that what it means
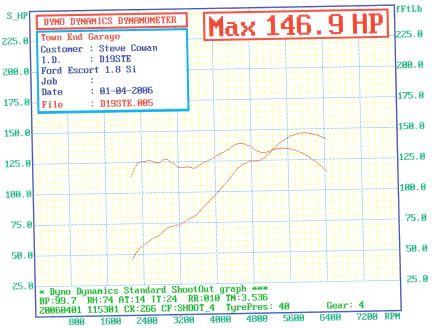
just noticed they had my tyre pressure at 40psi if that what it means
31-10-2008, 11:06 AM
#40
PassionFord Post Troll