
Computer/Excel experts!!!


Thread Starter
15K+ Super Poster!!
Joined: May 2003
Posts: 18,745
Likes: 0
From: South Wales, GB
Ok Cabrio cheers. Anyone else able to help this eve? if not be for morn. though would be better asap. 
This is the info:
Importance...................BMW Strength
R1: 7..................................7
R2: 8...................................6
R3: 6................................... 5
R4: 8.................................... 7
C1: 7....................................9
C2: 8....................................8
C3: 9...................................7
C4: 7...................................4
C5: 9...................................5
What i would like is x axis on bottom labled Strategic Important and Y Relative Stregnth. Then i need R1 ploted on that axis etc.
Anyone?

Thread Starter
15K+ Super Poster!!
Joined: May 2003
Posts: 18,745
Likes: 0
From: South Wales, GB
kevandalice
Sorry the bb dont like me leaving spaces for some reason on here
So have ammend it crudley now! for the first one R1: first 7 is Strategoc importance and then the 7 next to it is relative strength.
Thanks for help...
Sorry the bb dont like me leaving spaces for some reason on here
So have ammend it crudley now! for the first one R1: first 7 is Strategoc importance and then the 7 next to it is relative strength.
Thanks for help...
Trending Topics

Thread Starter
15K+ Super Poster!!
Joined: May 2003
Posts: 18,745
Likes: 0
From: South Wales, GB
really need it in scatter graph so the first one on a 7 & 7 R1 would be located near top left corner etc. I got example here but for somereason my scanner is not working  Computers dont you just love them? lol
Computers dont you just love them? lol

Thread Starter
15K+ Super Poster!!
Joined: May 2003
Posts: 18,745
Likes: 0
From: South Wales, GB
kevandalice
That looks spot on mate, though i need to distinguish what dot is what. Ie Re 1 blue R2 is red etc? Sry being a pain
Got my scanner to work, just uploading cop of thing i need now.
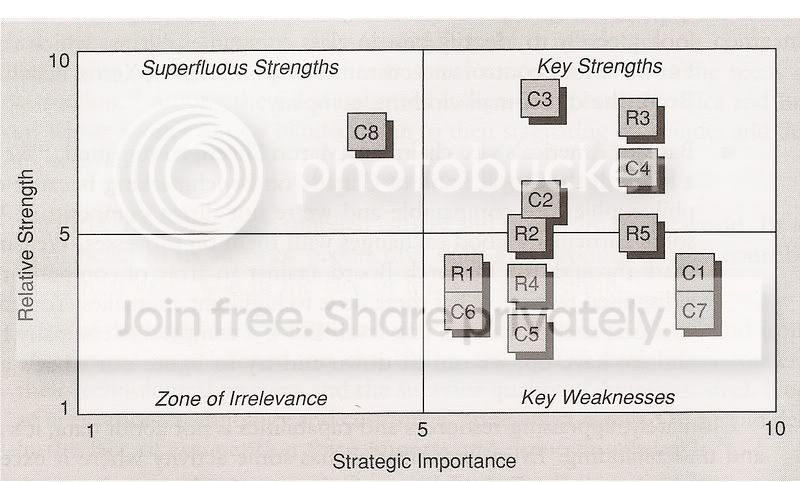
Right i know im taking the pissssss now. But I need the table then to have to lines one horizontal and the other verticl. With top right corner saying Key Strengths, Top left, Superfluous Strengths bottom left Xone of Irrelevance and bottom right Key Weaknesses.
I know im taking the piss but im desperate has i got old shitty comp that cant do fook all. and the operater isnt much better
That looks spot on mate, though i need to distinguish what dot is what. Ie Re 1 blue R2 is red etc? Sry being a pain
Got my scanner to work, just uploading cop of thing i need now.
Right i know im taking the pissssss now. But I need the table then to have to lines one horizontal and the other verticl. With top right corner saying Key Strengths, Top left, Superfluous Strengths bottom left Xone of Irrelevance and bottom right Key Weaknesses.
I know im taking the piss but im desperate has i got old shitty comp that cant do fook all. and the operater isnt much better
Thread Starter
15K+ Super Poster!!
Joined: May 2003
Posts: 18,745
Likes: 0
From: South Wales, GB
Right finall here it is..... Basically i need it to look close to this. I know its not going to be identialy. but if could have legend on side of which point is what etc.


PassionFord Post Whore!!
Joined: Jul 2003
Posts: 4,275
Likes: 0
From: Sudbury Suffolk, Drives: Octavia VRS & XR2i 1800 Zetec track car
I couldn't see a way of doing in it Excel, I'm not clever enough, so I just copied it in PowerPoint is this how you wanted it? Can email you the powerpoint slide or in Word if you like

Thread Starter
15K+ Super Poster!!
Joined: May 2003
Posts: 18,745
Likes: 0
From: South Wales, GB
Cabrio it would have been nice like i have posted above. but tbh i know its never going to get like that without serious programe. Smidsy sorted me out with excel Scatter graph though.. Which will do for the assignment

Thread
Thread Starter
Forum
Replies
Last Post
DavidK
Ford Sierra/Sapphire/RS500 Cosworth
1
Sep 27, 2015 02:55 PM
puntoturbo
General Car Related Discussion.
9
May 4, 2005 02:10 PM